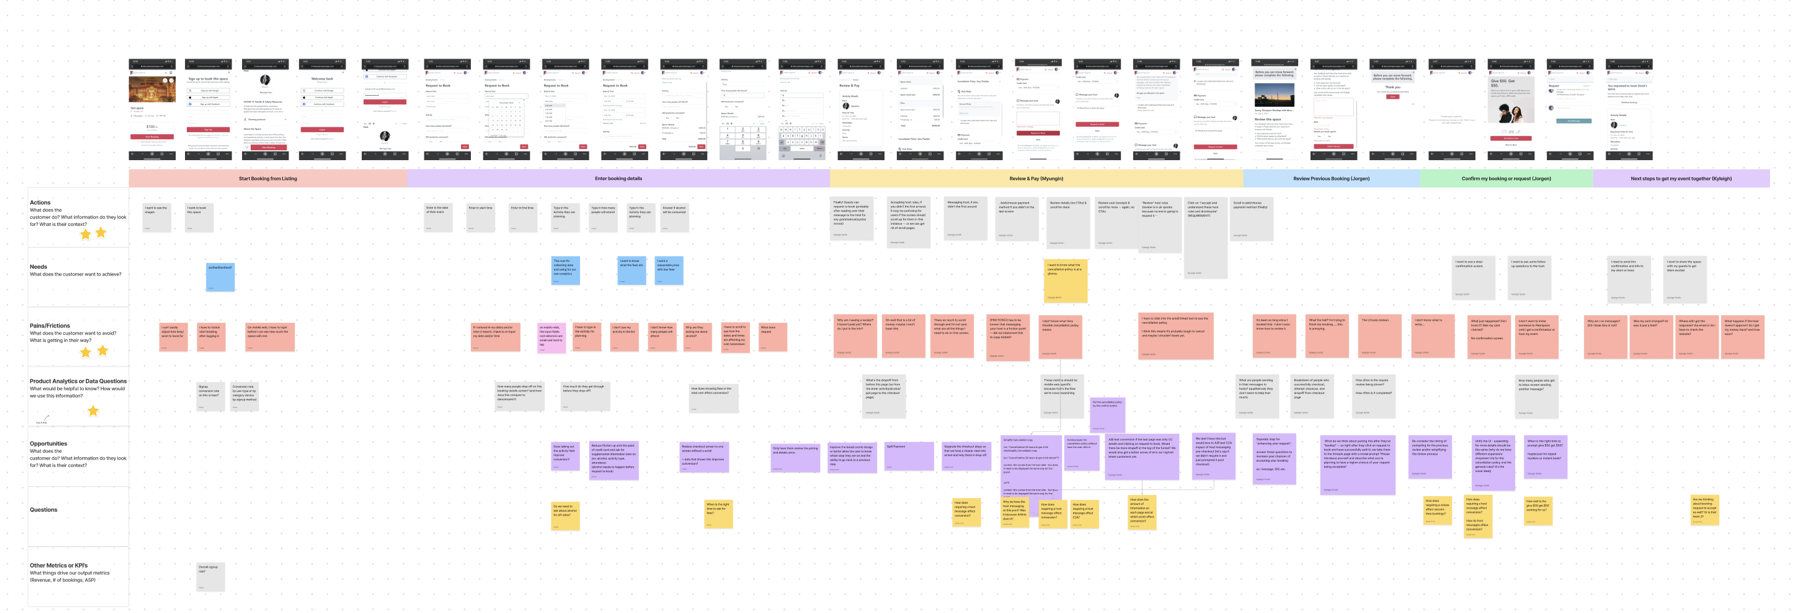
Design challenges
What made this project difficult
- Skeptical, analytical engineering leaders had to trust the number before they’d use it.
- Non-technical executives had to understand the answer from a single slide.
- We needed an entirely new approach that didn’t require attributing code to AI or humans.
Impact
New departments asked for access for the first time.
2 exec meetings
Used in 2 exec meetings right away, and in a key customer’s Executive Scorecard.
Closed a deal
Turning the beta on during a pilot influenced a customer’s decision to convert.
“Spot on”
An engineering leader at a large tech company on our whitepaper.
Prototyping in code, against pass/fail gates
Before designing anything, I wrote a validation plan: the risks, a gate for each, how we’d test it, and what passing looked like. We’d prototype in code with Claude and HTML for 1–2 weeks and keep iterating until every gate passed.
The first gate came from Quotient’s values: nobody should come away feeling reduced to a dollar amount.
Gate 1 · Engineer acceptability
Nothing makes engineers mad or defensive. Tested in 1:1 interviews on early concepts, language and metrics.
Gate 2 · Methodology buy-in
At least 2 testers can name a specific use case. We walked engineering leaders through the measure and asked if they could stand behind it.
Gate 3 · Sellability
At least 2 customers cite it as a reason to buy. Shown to customers in the sales pipeline.
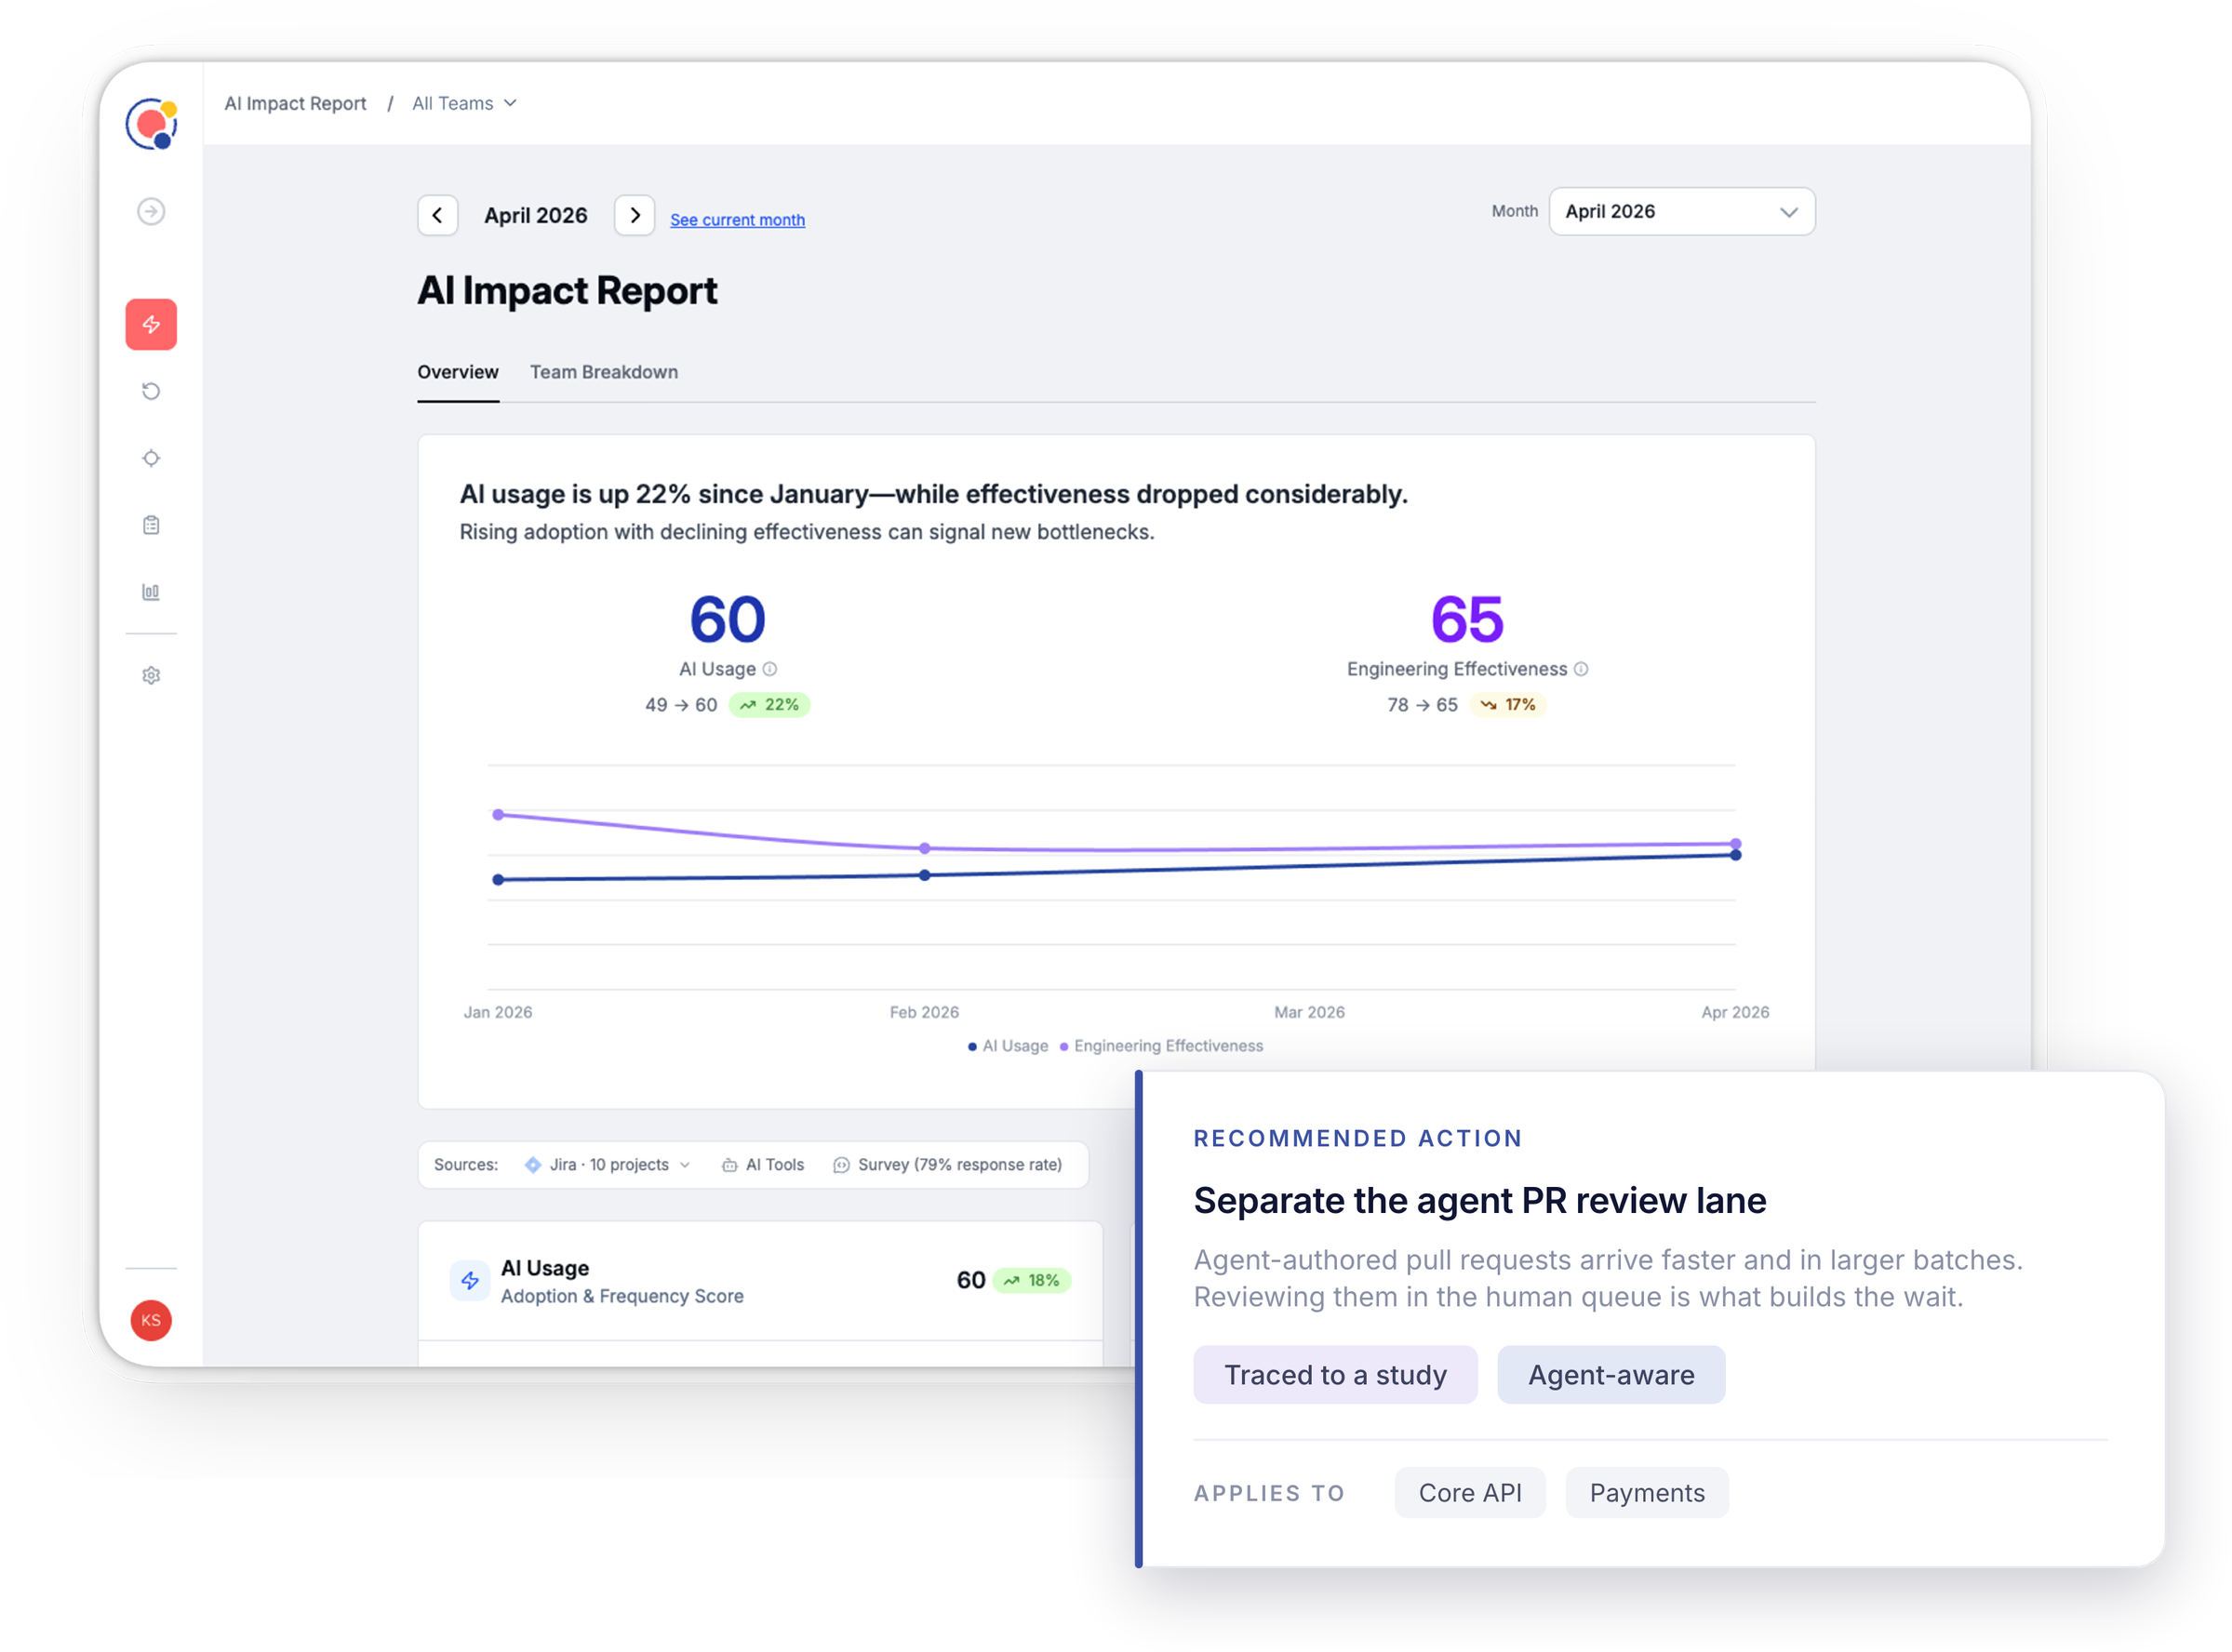
Design challenges
What made this project difficult
- AI best practices were still forming, so there was no playbook for what to recommend.
- We were defining the metrics and their calculations while designing the feature.
- Every LLM insight had to be specific enough for a team to act on.
Prototyping the recommendations in Claude
Before writing a spec, I needed to know what kinds of insights the model could produce from our data, and how to prompt it to meet our quality bar.
I pulled metric snapshots for 10 companies, prototyped in Claude, and turned what I learned into a brief to build toward and an eval to test the output against.
Kyleigh
im going to give you 10 different examples of this data set, can you put into a table with company and then each metric value and the one month change? here is the first one
lets start with table first to make sure we like the format
Claude
Built the format on the first example so you could sanity-check the columns before loading the rest.
Kyleigh
if we only count deltas more than 10% significant, what are the big stories you are pulling out for each company
Claude
Filtered to moves over 10% and pulled one story per company. One team’s velocity and coverage jumped while cycle time dropped. Another’s flow metrics all rose at once.
Design challenges
What made this project difficult
- Two days to turn a founders’ brief into design concepts.
- A maturity score only works if engineering leaders believe the model behind it.
Impact
The model outgrew the feature it was built for.
Keynote
Became the basis for our CEO’s QCon keynote.
#1
Source of qualified inbound leads.
The research was a dinner table
I asked to join our sales dinners with engineering leaders to hear how they talked about AI adoption in their own words.
Each leader described where their company stood by what their teams were actually doing. I built each stage of the model around those behaviors and kept their language, which I believe is why it resonated with the market.
I shared over our maturity model with them and they used it in their eng offsite last week to set strategy. They’re at stage 2, and want to enable a few teams to try stage 3 and eventually get the whole organization there.
They’re worried about how much token spend is increasing, and how to drive that to outcomes.
Design challenges
What made this project difficult
- Guests couldn’t see what a booking cost until step six of checkout.
- 21% of live hosts priced by headcount, and guests didn’t see that cost until checkout.
- The team feared that showing the full price upfront would hurt conversion.
Impact
We shipped it with limited data, and conversion held.
6 → 0
Steps between opening a listing and seeing the full total
Upfront
Guests can see whether a space fits their budget before starting checkout.
No drop
Conversion held steady after launch. The drop the team feared didn’t happen.
Getting the team to a decision
First I sized the problem: 21% of live hosts priced by headcount, and their guests couldn’t see that cost until checkout.
Then I ran a design studio with product and engineering so they shaped the solution with me. Last, I laid out the options and the worst case myself.
Option 1
Pull more data on how often, and by how much, variable costs actually move the final price.
Option 2
Run an A/B test on showing the price breakdown upfront. (My recommendation.)
Option 3
Ship it and measure conversion before and after. Worst case, it drops and we roll back, and we still learn how price-sensitive guests are.
Design challenges
What made this project difficult
- Mobile web checkout had been neglected for years, and a lot of it was broken.
- With so much to fix, the team didn’t know where to start.
- Guests kept missing a required host-rules checkbox, and the error didn’t show them where.
Impact
Mobile web checkout cleared 60% for the first time in over a year.
+7 pts
payment page conversion on mobile web
54% → 61%
previous-year average to a year-high after release
1 week
from release to a measurable lift
Running the workshop
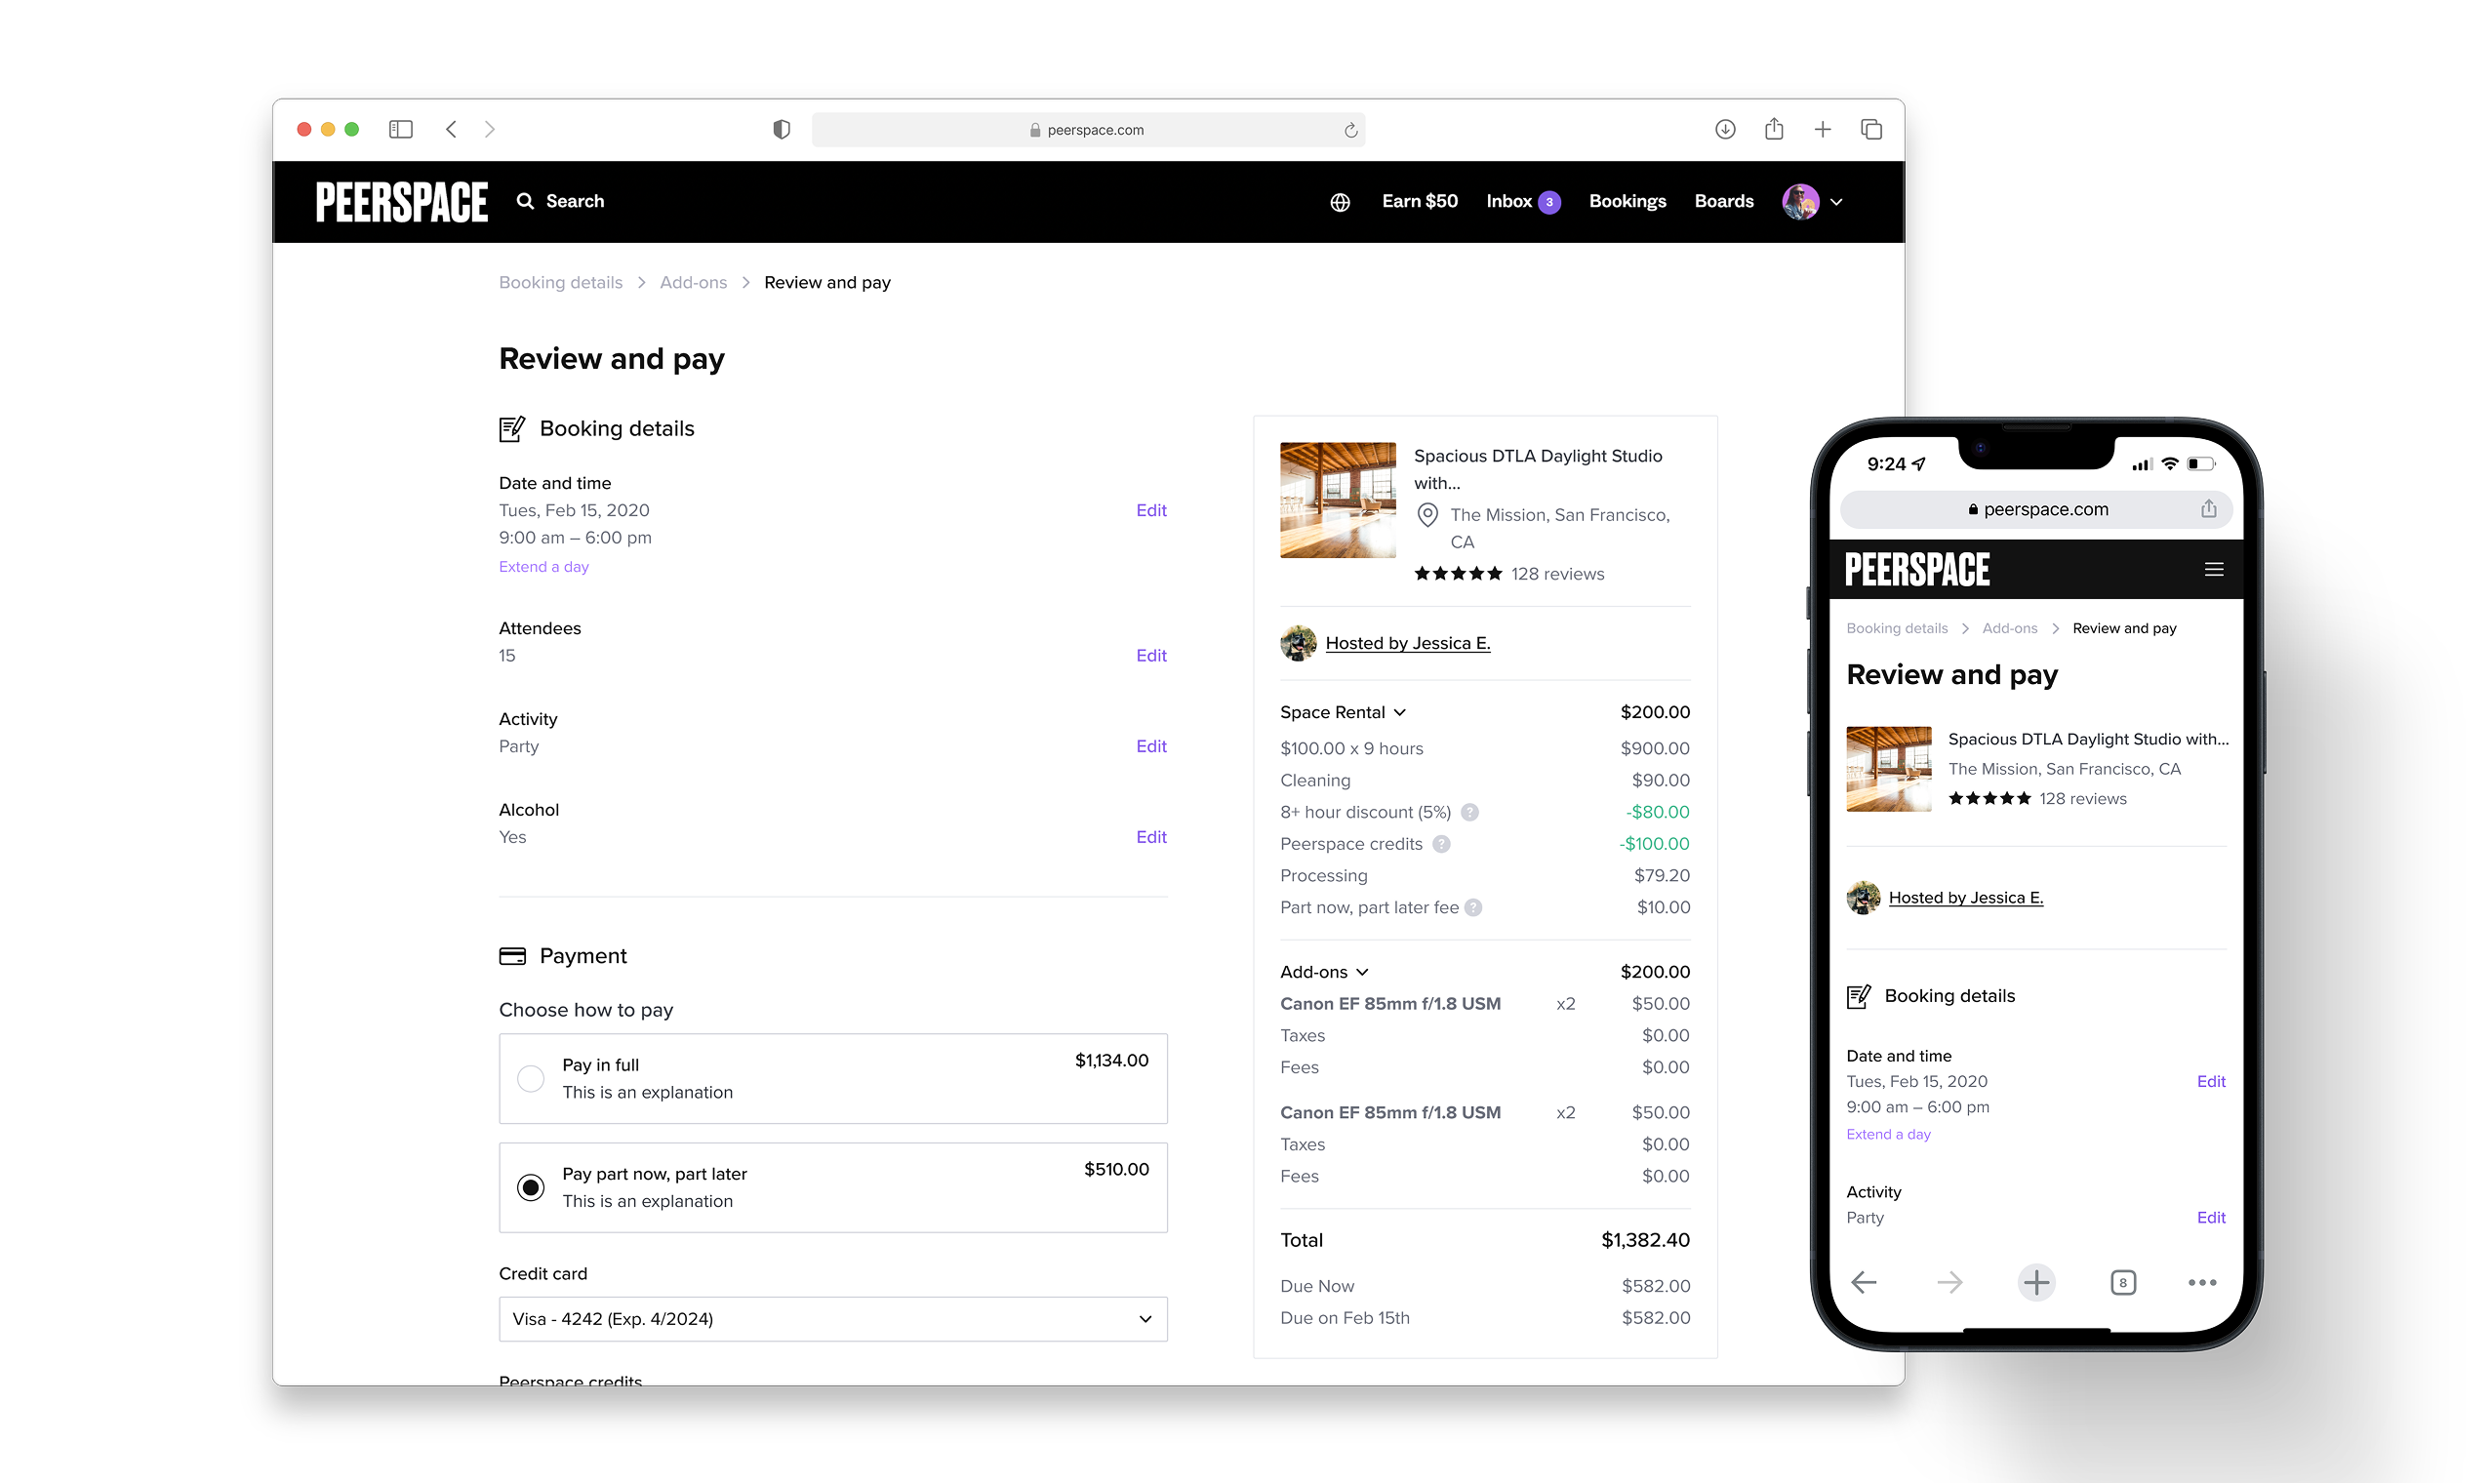
I had 8 people and an hour. I split them into pairs, gave each pair one row of the canvas, and had them go through checkout on their own devices for 20 minutes. Then we shared and refined the notes as a group, and put the easy fixes in the backlog. The checkbox fix was one of them.
The finished canvas, one column per checkout screen.